Statistical significance
In statistics, a result is called statistically significant if it is unlikely to have occurred by chance. The phrase test of significance was coined by Ronald Fisher.[1]
As used in statistics, significant does not mean important or meaningful, as it does in everyday speech. For example, a study that included tens of thousands of participants might be able to say with great confidence that people of one state were more intelligent than people of another state by 1/20 of an IQ point. This result would be statistically significant, but the difference is small enough to be utterly unimportant. Many researchers urge that tests of significance should always be accompanied by effect-size statistics, which approximate the size and thus the practical importance of the difference.
The amount of evidence required to accept that an event is unlikely to have arisen by chance is known as the significance level or critical p-value: in traditional Fisherian statistical hypothesis testing, the p-value is the probability conditional on the null hypothesis of the observed data or more extreme data. If the obtained p-value is small then it can be said either the null hypothesis is false or an unusual event has occurred. It is worth stressing that p-values do not have any repeat sampling interpretation.
An alternative statistical hypothesis testing framework is the Neyman-Pearson frequentist school which requires that both a null and an alternative hypothesis to be defined and investigates the repeat sampling properties of the procedure, i.e. the probability that a decision to reject the null hypothesis will be made when it is in fact true and should not have been rejected (this is called a "false positive" or Type I error) and the probability that a decision will be made to accept the null hypothesis when it is in fact false (Type II error).
More typically, the significance level of a test is such that the probability of mistakenly rejecting the null hypothesis is no more than the stated probability. This allows the test to be performed using non-significant statistics which has the advantage of reducing the computational burden while wasting some information.
It is worth stressing that Fisherian p-values are philosophically different from Neyman-Pearson Type I errors. This confusion is unfortunately propagated by many statistics textbooks.[2]
Contents |
Use in practice
The significance level is usually denoted by the Greek symbol α (lowercase alpha). Popular levels of significance are 5% (0.05), 1% (0.01) and 0.1% (0.001). If a test of significance gives a p-value lower than the α-level, the null hypothesis is rejected. Such results are informally referred to as 'statistically significant'. For example, if someone argues that "there's only one chance in a thousand this could have happened by coincidence," a 0.001 level of statistical significance is being implied. The lower the significance level, the stronger the evidence required. Choosing level of significance is an arbitrary task, but for many applications, a level of 5% is chosen, for no better reason than that it is conventional.[3][4]
In some situations it is convenient to express the statistical significance as 1 − α. In general, when interpreting a stated significance, one must be careful to note what, precisely, is being tested statistically.
Different α-levels trade off countervailing effects. Smaller levels of α increase confidence in the determination of significance, but run an increased risk of failing to reject a false null hypothesis (a Type II error, or "false negative determination"), and so have less statistical power. The selection of an α-level thus inevitably involves a compromise between significance and power, and consequently between the Type I error and the Type II error. More powerful experiments - usually experiments with more subjects or replications - can obviate this choice to an arbitrary degree.
In some fields, for example nuclear and particle physics, it is common to express statistical significance in units of "σ" (sigma), the standard deviation of a Gaussian distribution. A statistical significance of " " can be converted into a value of α via use of the error function:
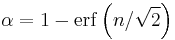
The use of σ implicitly assumes a Gaussian distribution of measurement values. For example, if a theory predicts a parameter to have a value of, say, 100, and one measures the parameter to be 109 ± 3, then one might report the measurement as a "3σ deviation" from the theoretical prediction. In terms of α, this statement is equivalent to saying that "assuming the theory is true, the likelihood of obtaining the experimental result by coincidence is 0.27%" (since 1 − erf(3/√2) = 0.0027).
Fixed significance levels such as those mentioned above may be regarded as useful in exploratory data analyses. However, modern statistical advice is that, where the outcome of a test is essentially the final outcome of an experiment or other study, the p-value should be quoted explicitly. And, importantly, it should be quoted whether the p-value is judged to be significant. This is to allow maximum information to be transferred from a summary of the study into meta-analyses.
Pitfalls
A common misconception is that a statistically significant result is always of practical significance, or demonstrates a large effect in the population. Unfortunately, this problem is commonly encountered in scientific writing.[5] Given a sufficiently large sample, extremely small and non-notable differences can be found to be statistically significant, and statistical significance says nothing about the practical significance of a difference.
One of the more common problems in significance testing is the tendency for multiple comparisons to yield spurious significant differences even where the null hypothesis is true. For instance, in a study of twenty comparisons, using an α-level of 5%, one comparison will likely yield a significant result despite the null hypothesis being true. In these cases p-values are adjusted in order to control either the familywise error rate or the false discovery rate.
An additional problem is that frequentist analyses of p-values are considered by some to overstate "statistical significance".[6][7] See Bayes factor for details.
Yet another common pitfall often happens when a researcher writes the qualified statement "we found no statistically significant difference," which is then misquoted by others as "they found that there was no difference." Actually, statistics cannot be used to prove that there is exactly zero difference between two populations. Failing to find evidence that there is a difference does not constitute evidence that there is no difference. This principle is sometimes described by the maxim "Absence of evidence is not evidence of absence."[8]
According to J. Scott Armstrong, attempts to educate researchers on how to avoid pitfalls of using statistical significance have had little success. In the papers "Significance Tests Harm Progress in Forecasting,"[9] and "Statistical Significance Tests are Unnecessary Even When Properly Done,"[10] Armstrong makes the case that even when done properly, statistical significance tests are of no value. A number of attempts failed to find empirical evidence supporting the use of significance tests. Tests of statistical significance are harmful to the development of scientific knowledge because they distract researchers from the use of proper methods. Armstrong suggests authors should avoid tests of statistical significance; instead, they should report on effect sizes, confidence intervals, replications/extensions, and meta-analyses.
Use of the statistical significance test has been called seriously flawed and unscientific by authors Deirdre McCloskey and Stephen Ziliak. They point out that "insignificance" does not mean unimportant, and propose that the scientific community should abandon usage of the test altogether, as it can cause false hypotheses to be accepted and true hypotheses to be rejected.[5][11]
Signal–noise ratio conceptualisation of significance
Statistical significance can be considered to be the confidence one has in a given result. In a comparison study, it is dependent on the relative difference between the groups compared, the amount of measurement and the noise associated with the measurement. In other words, the confidence one has in a given result being non-random (i.e. it is not a consequence of chance) depends on the signal-to-noise ratio (SNR) and the sample size.
Expressed mathematically, the confidence that a result is not by random chance is given by the following formula by Sackett:[12]
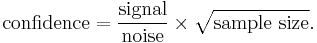
For clarity, the above formula is presented in tabular form below.
Dependence of confidence with noise, signal and sample size (tabular form)
| Parameter | Parameter increases | Parameter decreases |
|---|---|---|
| Noise | Confidence decreases | Confidence increases |
| Signal | Confidence increases | Confidence decreases |
| Sample size | Confidence increases | Confidence decreases |
In words, the dependence of confidence is high if the noise is low and/or the sample size is large and/or the effect size (signal) is large. The confidence of a result (and its associated confidence interval) is not dependent on effect size alone. If the sample size is large and the noise is low a small effect size can be measured with great confidence. Whether a small effect size is considered important is dependent on the context of the events compared.
In medicine, small effect sizes (reflected by small increases of risk) are often considered clinically relevant and are frequently used to guide treatment decisions (if there is great confidence in them). Whether a given treatment is considered a worthy endeavour is dependent on the risks, benefits and costs.
See also
- Statistical hypothesis testing
- A/B testing
- ABX test
- Fisher's method for combining independent tests of significance
- Reasonable doubt
References
- ↑ "Critical tests of this kind may be called tests of significance, and when such tests are available we may discover whether a second sample is or is not significantly different from the first." — R. A. Fisher (1925). Statistical Methods for Research Workers, Edinburgh: Oliver and Boyd, 1925, p.43.
- ↑ Raymond Hubbard, M.J. Bayarri, P Values are not Error Probabilities. A working paper that explains the difference between Fisher's evidential p-value and the Neyman-Pearson Type I error rate
 .
. - ↑ Stigler S (2008). "Fisher and the 5% level". Chance 21 (4): 12. doi:10.1007/s00144-008-0033-3.
- ↑ Fisher RA (1925). Statistical Methods for Research Workers (first ed.). Edinburgh: Oliver & Boyd.
- ↑ 5.0 5.1 Ziliak, Stephen T. and Deirdre N. McCloskey. "Size Matters: The Standard Error of Regressions in the American Economic Review" (August 2004). [1]
- ↑ Goodman S (1999). "Toward evidence-based medical statistics. 1: The P value fallacy.". Ann Intern Med 130 (12): 995–1004. PMID 10383371. http://www.annals.org/cgi/pmidlookup?view=long&pmid=10383371.
- ↑ Goodman S (1999). "Toward evidence-based medical statistics. 2: The Bayes factor.". Ann Intern Med 130 (12): 1005–13. PMID 10383350. http://www.annals.org/cgi/pmidlookup?view=long&pmid=10383350.
- ↑ BMJ 1995;311:485. Statistics notes: "Absence of evidence is not evidence of absence". Douglas G Altman, J Martin Bland.
- ↑ Armstrong, J. Scott (2007). "Significance tests harm progress in forecasting". International Journal of Forecasting 23: 321–327. doi:10.1016/j.ijforecast.2007.03.004.
- ↑ Armstrong, J. Scott (2007). "Statistical Significance Tests are Unnecessary Even When Properly Done". International Journal of Forecasting 23: 335–336. doi:10.1016/j.ijforecast.2007.01.010.
- ↑ McCloskey, Deirdre N.; Stephen T. Ziliak (2008). The Cult of Statistical Significance: How the Standard Error Costs Us Jobs, Justice, and Lives (Economics, Cognition, and Society). The University of Michigan Press. ISBN 0472050079.
- ↑ Sackett DL (October 2001). "Why randomized controlled trials fail but needn't: 2. Failure to employ physiological statistics, or the only formula a clinician-trialist is ever likely to need (or understand!)". CMAJ 165 (9): 1226–37. PMID 11706914. PMC 81587. http://www.cmaj.ca/cgi/pmidlookup?view=long&pmid=11706914.
Further reading
- Ziliak, Stephen, and McCloskey, Deirdre, (2008). The Cult of Statistical Significance: How the Standard Error Costs Us Jobs, Justice, and Lives. Ann Arbor, University of Michigan Press, 2009.
- Thompson, Bruce, (2004). The "significance" crisis in psychology and education. Journal of Socio-Economics, 33, pp. 607–613.
External links
- Earliest Uses: The entry on Significance has some historical information.
- Raymond Hubbard, M.J. Bayarri, P Values are not Error Probabilities. A working paper that explains the difference between Fisher's evidential p-value and the Neyman-Pearson Type I error rate .
- The Concept of Statistical Significance Testing - Article by Bruce Thompon of the ERIC Clearinghouse on Assessment and Evaluation, Washington, D.C.
|
|||||||||||||||||||||||||||||||||||||||||||||||||||||||||||||||||||||||||||||||||||||||||||||||||||||||||||||||||||||||||||||||||||||||||